Analysis GBP/USD 5M
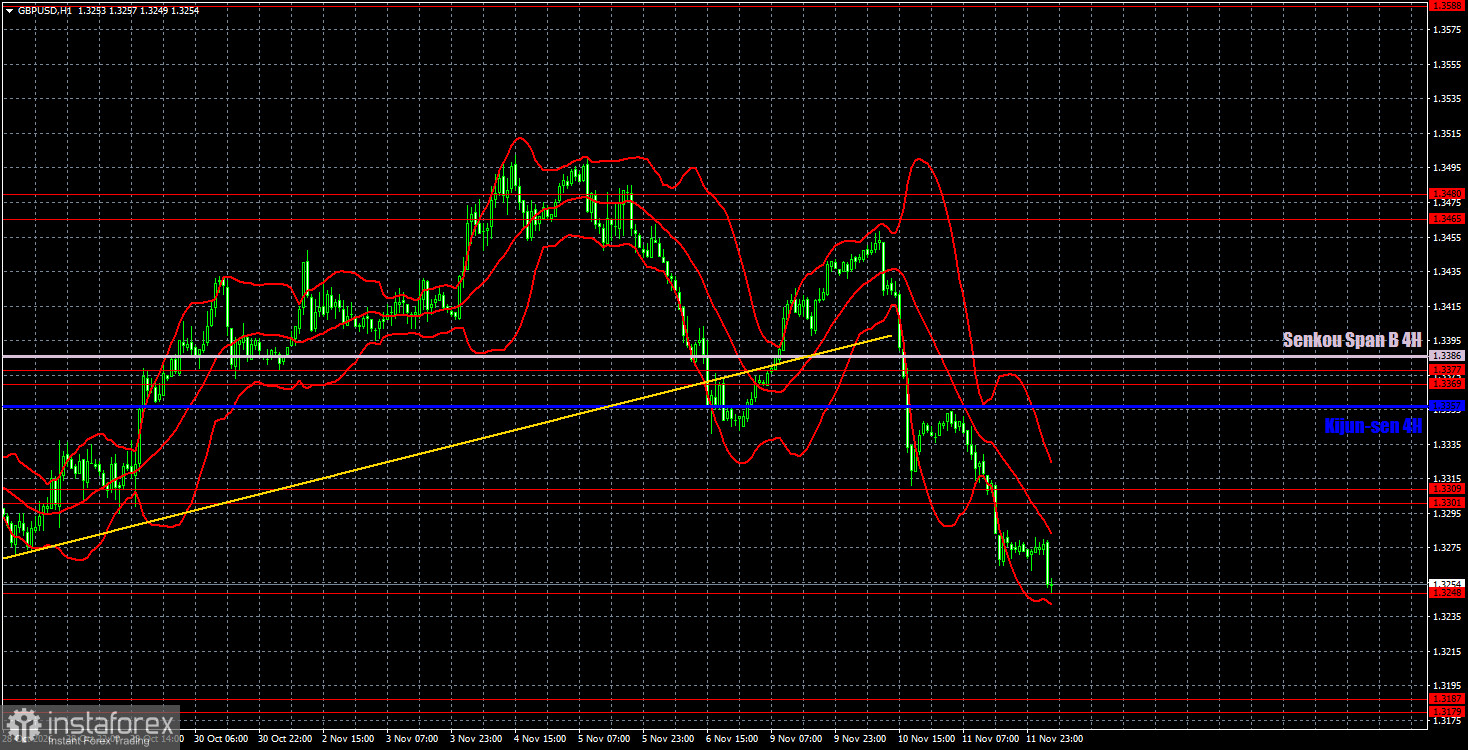
The GBP/USD pair also moved lower on Wednesday, a decline that is hard to justify even in hindsight. Overall, sterling continues to correct against the uptrend after the ascending trendline was breached, so technically the drop is consistent. But over the past week, the British currency has fallen too sharply to treat this move as a mere correction. Even overnight, the dollar continued to strengthen, and the market has been processing US inflation reports across two days. Note that Tuesday's inflation report did not provide annual figures, and even those truncated numbers sparked a two-day rise in the US currency. The Federal Reserve has raised its policy rate as many times as the Bank of England, yet GBP/USD is sliding again after EUR/USD. In recent weeks, the pound traded technically, but the new collapse raises fears of an anomalous, illogical sell-off similar to what happened with the euro. Sterling is still supported by two sideways channels on the daily and weekly timeframes, but if unchecked, illogical liquidations will begin; nothing will save the pound.
Technically, sterling has moved into forming a downtrend after breaking the ascending trendline. Higher timeframes still support further gains in the longer term, but the pound is again falling too fast and too far, heading toward the lower boundary of the two major sideways channels.
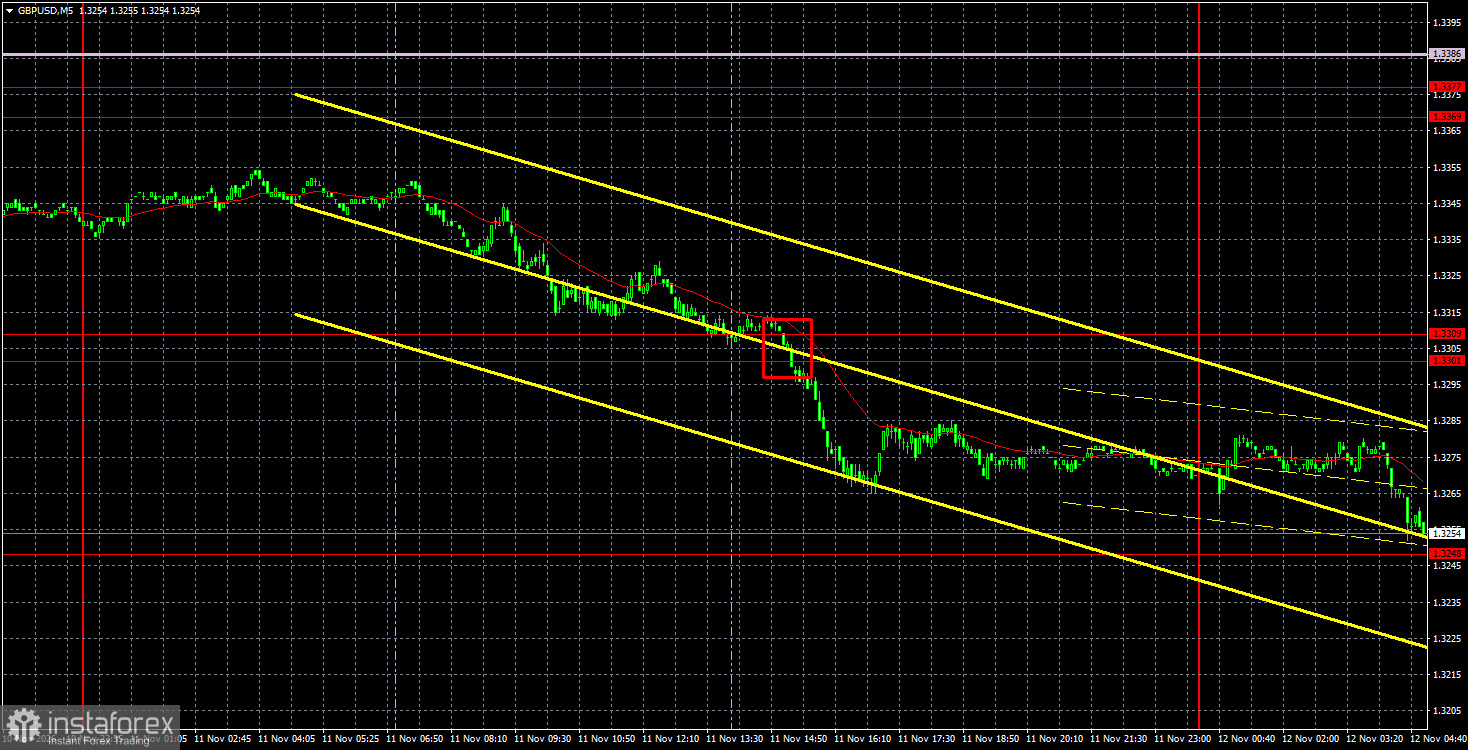
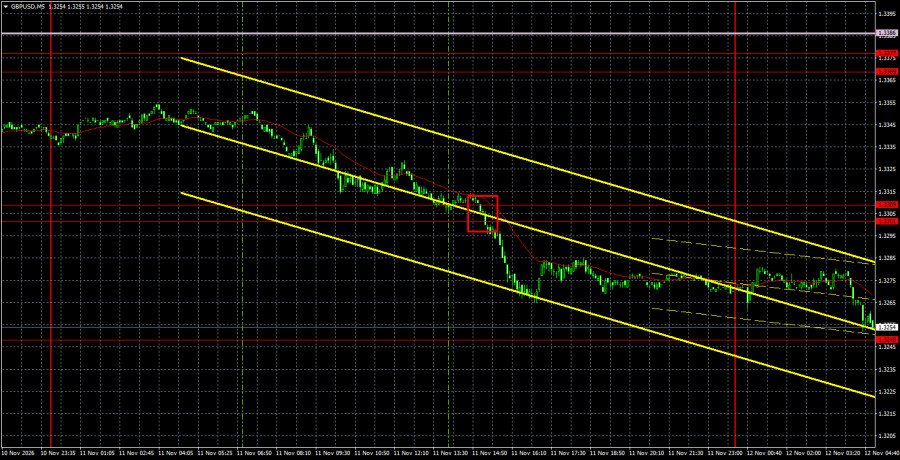
On the 5-minute timeframe, only one sell signal formed on Wednesday. Early in the US session, the price closed below the 1.3301–1.3309 area, allowing traders to open short positions. Overnight, the nearest target — the 1.3248 level — was reached.
COT Report
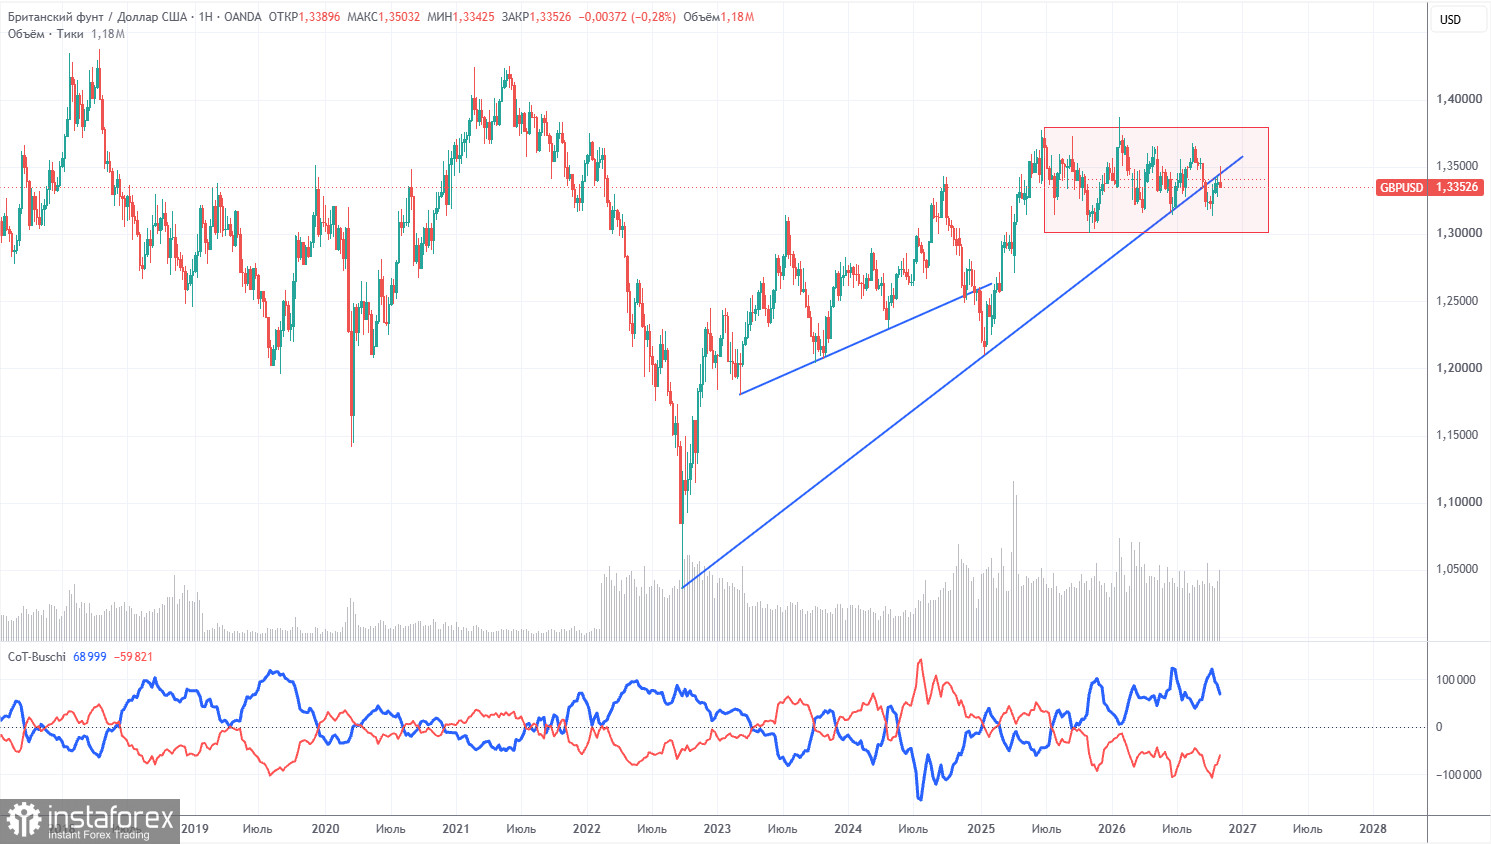
COT reports for the British pound show that non-commercial traders have dominated the market with short positions throughout 2026. The net position is negative despite the maintenance of a long-term uptrend. Given events in the Middle East, it is unsurprising that demand for the dollar remains fairly high in 2026. The war between the US and Iran has been formally put on pause but could resume at any moment. The Fed's changed stance on monetary policy also supports the dollar, and the ascending trendline was breached. However, it was breached within a flat, so we do not consider the uptrend to be finished.
In the long run, the dollar continues to weaken due to Donald Trump's policies, which is clearly visible on the weekly timeframe. The trade war will continue in one form or another for a long time, and Trump's policies aim directly and indirectly to weaken the US currency. The long-term uptrend remains intact. According to the latest COT report (dated November 3), the "Non-commercial" group opened 7,100 BUY contracts and closed 12,500 SELL contracts. Thus, the net position of non-commercial traders increased by 19,600 contracts over the week.
Analysis GBP/USD 1H
On the hourly timeframe, GBP/USD has entered a downward correction but still retains a bullish bias. On the daily and weekly timeframes, the pair is targeting 1.3650, which is the upper boundary of the sideways channel on the daily chart. Fundamental and macroeconomic reasons for the pound's rise are not necessary, since GBP/USD remains inside sideways channels on higher timeframes. In recent days, US data have caused another anomalous rise in the dollar.
For November 12 we highlight the following important levels: 1.3042–1.3050, 1.3096–1.3115, 1.3179–1.3187, 1.3248, 1.3301–1.3309, 1.3369–1.3377, 1.3465–1.3480, 1.3588, 1.3671–1.3681. The Ichimoku Senkou Span B (1.3386) and Kijun-sen (1.3357) lines can also generate signals. It is recommended to move the Stop Loss to breakeven when the price moves 20 pips in the correct direction. The Ichimoku indicator lines may shift during the day, which should be considered when determining trade signals.
Today the UK will publish GDP and industrial production reports, which the market may well ignore given recent events (even if they show positive dynamics). If the reports are weak, the market will gladly continue buying the US dollar.
Summary of the above analysis:
Traders can consider the 1.3179–1.3187 area as a target for short positions if the 1.3248 level is broken. A bounce from 1.3248 would allow considering 1.3301–1.3309 as a target for long positions.
Notes on the charts:
- Support/resistance price levels (thick red lines) are areas where a move may stop; they are not direct signal sources.
- Kijun-sen and Senkou Span B — Ichimoku lines projected from the 4-hour timeframe onto the hourly chart — are strong levels.
- Extremum levels (thin red lines) are prior bounce points and do serve as signal sources.
- Yellow lines denote trendlines, trend channels, and other technical patterns.
- Indicator 1 on the charts (COT) shows the net position size for each trader category.