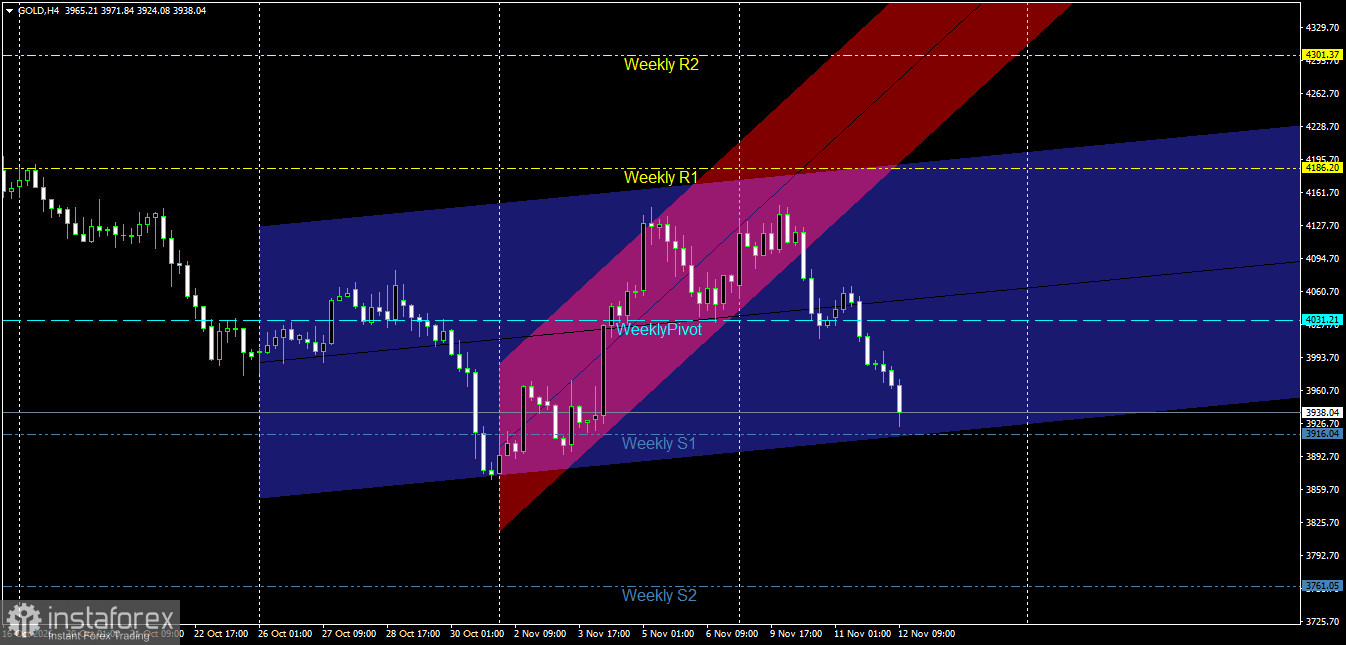
The four-hour (H4) chart for Gold (GOLD) reveals a notable shift in price momentum. Currently trading at 3938.04, the price has experienced an accelerated decline from previous highs near the upper resistance zones. In the process, it has broken through key technical midlines and boundaries, now positioning itself near critical levels—just steps away from testing lower weekly support levels.
Technical Analysis and Price Action
Price Channel Structure: The price has been moving within a broad, primary ascending channel (depicted in blue), which previously saw a strong upward surge. However, recent pullbacks have led to a downward breakout from a steeper, secondary ascending channel (depicted in pink/red). This bearish breakout signals a clear waning of buying momentum and an intensification of selling pressure in the short term, as the price now attempts to stabilize near the lower boundary of the primary channel.
Interaction with Weekly Pivot Levels: The price faced intense downward pressure after failing to hold above key resistance levels—specifically the weekly pivot point at 4031.21 and higher resistance levels, such as the first weekly resistance (Weekly R1) at 4186.20. Following this reversal, the price broke below the weekly pivot point and is now trading beneath it, moving toward the first weekly support level (Weekly S1) at 3916.04. Pivotal Support and Resistance Levels
Key Resistance Levels:
First Resistance: 4031.21 (Weekly Pivot point; a threshold for the intraday trend that has now turned into a strong resistance level).
Second Resistance: 4186.20 (Weekly R1 resistance level).
Pivotal Resistance: 4301.37 (Weekly R2 resistance level).
Key Support Levels:
First Support: 3916.04 (Weekly S1 support level; the near-term target for the current bearish momentum).
Second Support: 3850.00 (A psychological support level and a previous low).
Pivotal Support: 3761.05 (Weekly S2 support level, should the price decline extend further).
Price Movement Outlook and Trading Recommendations
Bearish Scenario (Primary):
The negative trend remains dominant and most likely to persist as long as the price stays below the nearby resistance levels and the weekly pivot point of 4031.21.
Recommendation: It is advisable to sell into any corrective upward rebounds toward the 3980.00–4020.00 range, provided these levels continue to cap any price gains.
Technical Targets: Aim for the first weekly support level at 3916.04, with the potential for further extension toward the 3850.00 area. Corrective Bullish Scenario (Alternative):
This scenario is triggered if sudden buying pressure emerges, successfully lifting prices from current levels and negating the impact of the recent breakdown.
Confirmation Condition: A 4-hour candle must close clearly above the weekly pivot level of 4031.21.
Technical Targets: This would pave the way for a fresh bullish correction, targeting resistance levels near 4186.20.
Risk Management:
During periods of momentum reversal or the breakdown of bullish channels in the gold market, traders are strongly cautioned against entering positions indiscriminately. It is essential to strictly adhere to rigorous capital management rules, limiting risk to a maximum of 2% per trade. Furthermore, stop-loss orders should be precisely placed to protect the portfolio from sharp volatility.
Gold Price Action on the Daily Chart:
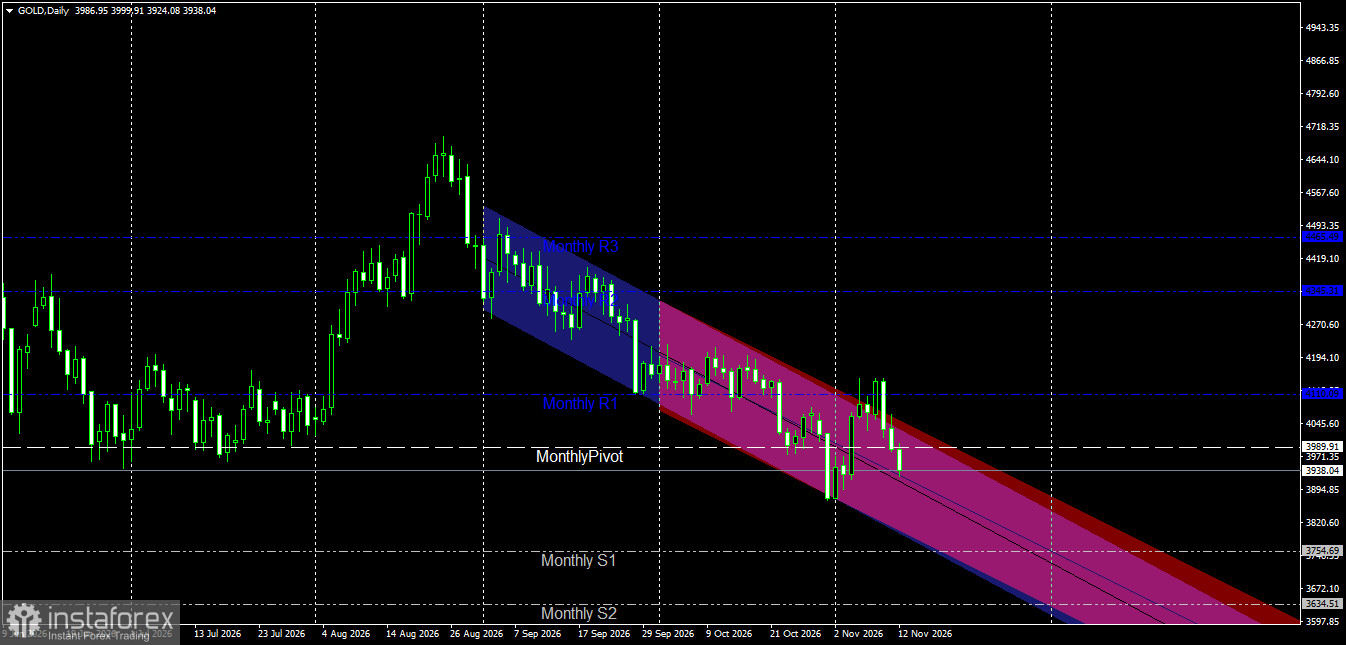
The price is currently trading at 3938.04 within a descending channel on the daily timeframe. It has retreated, falling back below the monthly pivot point of 3989.91, following a failure to sustain its position above the first monthly resistance level (Monthly R1) at 4110.09.
Analysis of the Last Two Candles (Yesterday and Today):
Yesterday's Candle: Reflected selling pressure and a decline that pushed the price back toward the monthly pivot point, following a downward reversal from the upper boundary of the descending channel.
Today's Candle: Indicates a continuation of the bearish momentum, with the price breaking below the monthly pivot point to settle at 3938.04, amid clear dominance by the bears.
Outlook for Future Movement:
Bearish Scenario (Primary): Remains highly probable as long as the price stays below the monthly pivot point of 3989.91 and within the descending channel. The decline may continue, targeting the first monthly support level (Monthly S1) at 3754.69.
Bullish Scenario (Alternative): Would be triggered if the price manages to rebound and achieve a daily close above 3989.91, potentially leading to a retest of the 4110.09 (Monthly R1) area.